

Dashboards & Reports That Turn Your Plan Into Answers
PlanGuru Analytics turns your budgets, forecasts, and actuals into live financial dashboards, polished reports, and AI-generated commentary, so you and your stakeholders see the story behind the numbers without rebuilding spreadsheets every month.
Available as an add-on to PlanGuru Business Plans and Advisor Plans.
Automation Meets Customization
PlanGuru Analytics gets you to a polished deliverable fast, then lets you shape every detail. Your PlanGuru model stays the single source of truth, so the plan you build is the plan you report on.
Dashboards That Keep a Pulse on Performance
Stop digging through Excel to find your key numbers. Financial dashboards turn rows of data into visuals decision-makers can absorb in seconds, and every one is built from flexible metrics you can resize, reorder, or rework.
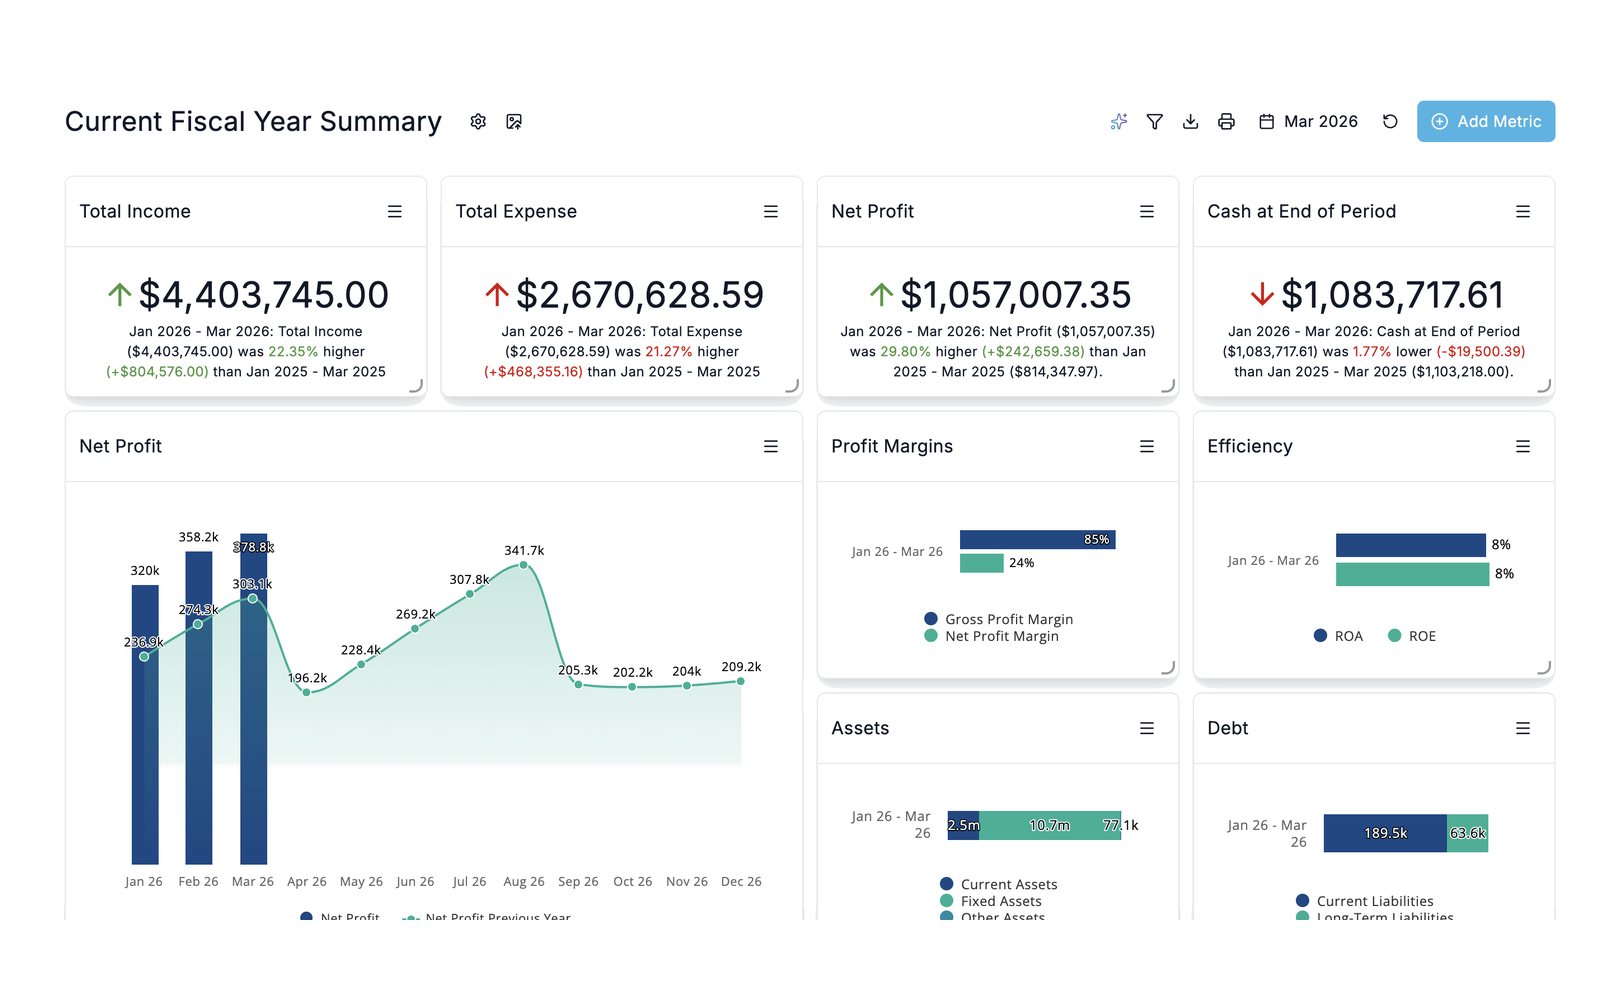
Start with a ready-made template like the Current Fiscal Year Summary, then add, resize, or rearrange metrics to fit how you manage the business.
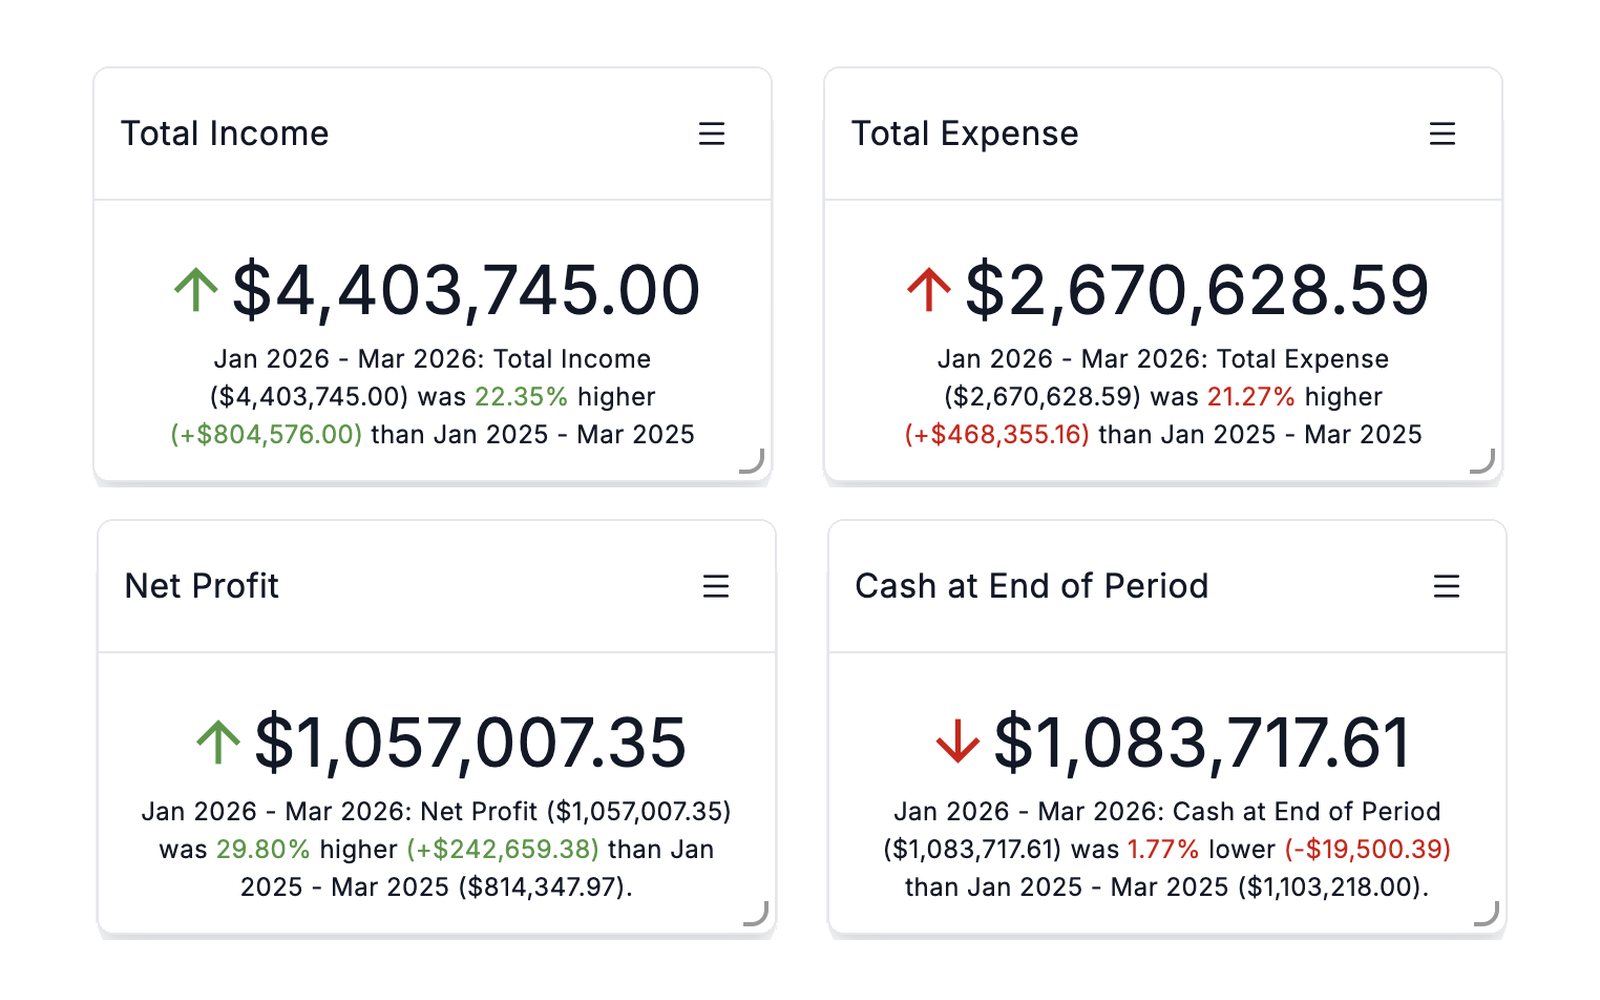
Headline numbers with automatic comparisons that update every time you sync. Perfect for budget vs. actual callouts and period-over-period changes.
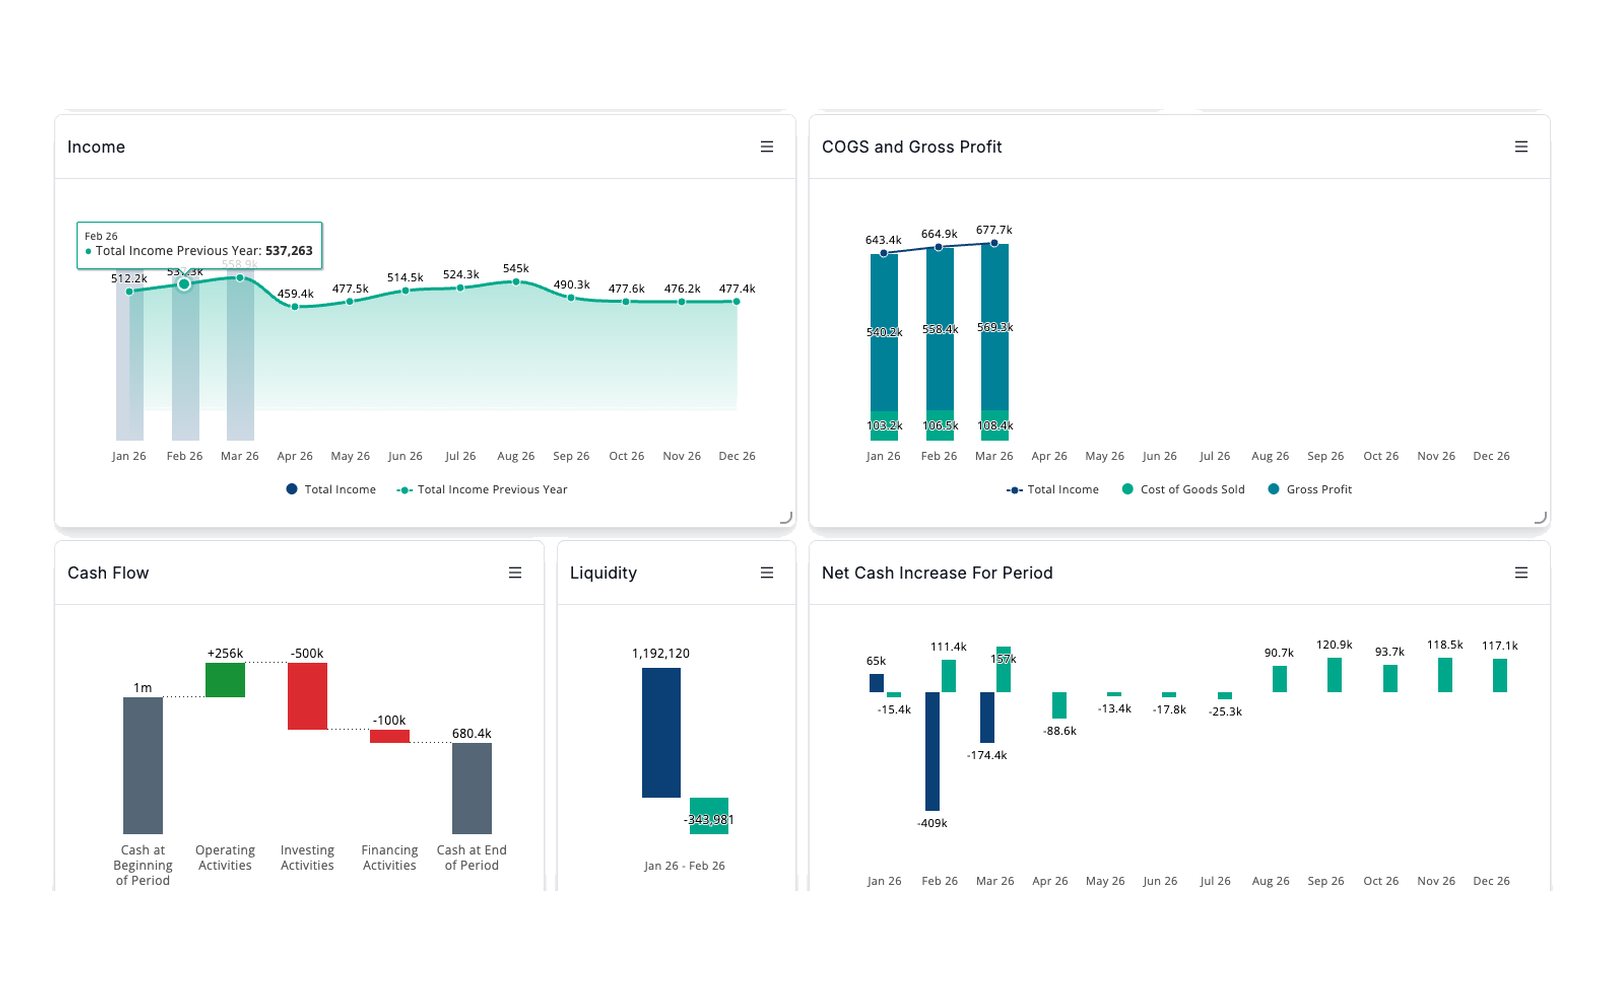
Column, line, bar, waterfall, and more. Filter the data, add custom calculations, and change colors and headers to match your brand.
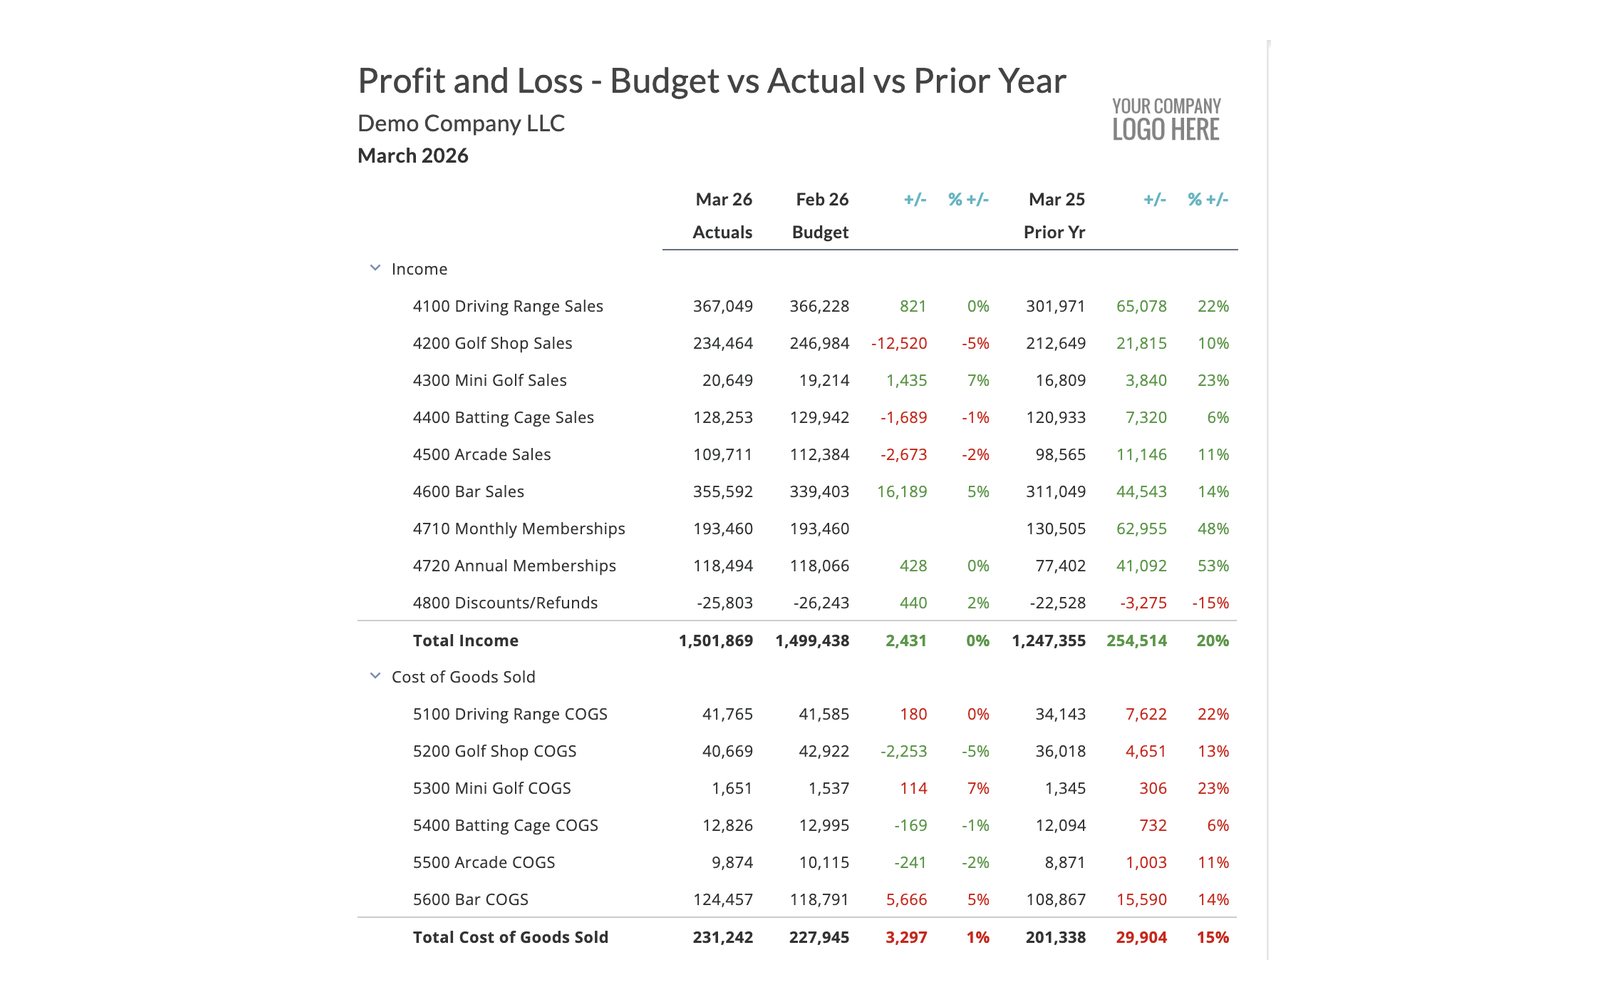
Pull full financial statements, specific accounts or assumption lines into a custom layout, with actuals, budget, and prior-year variances side by side. Great for executive summaries.
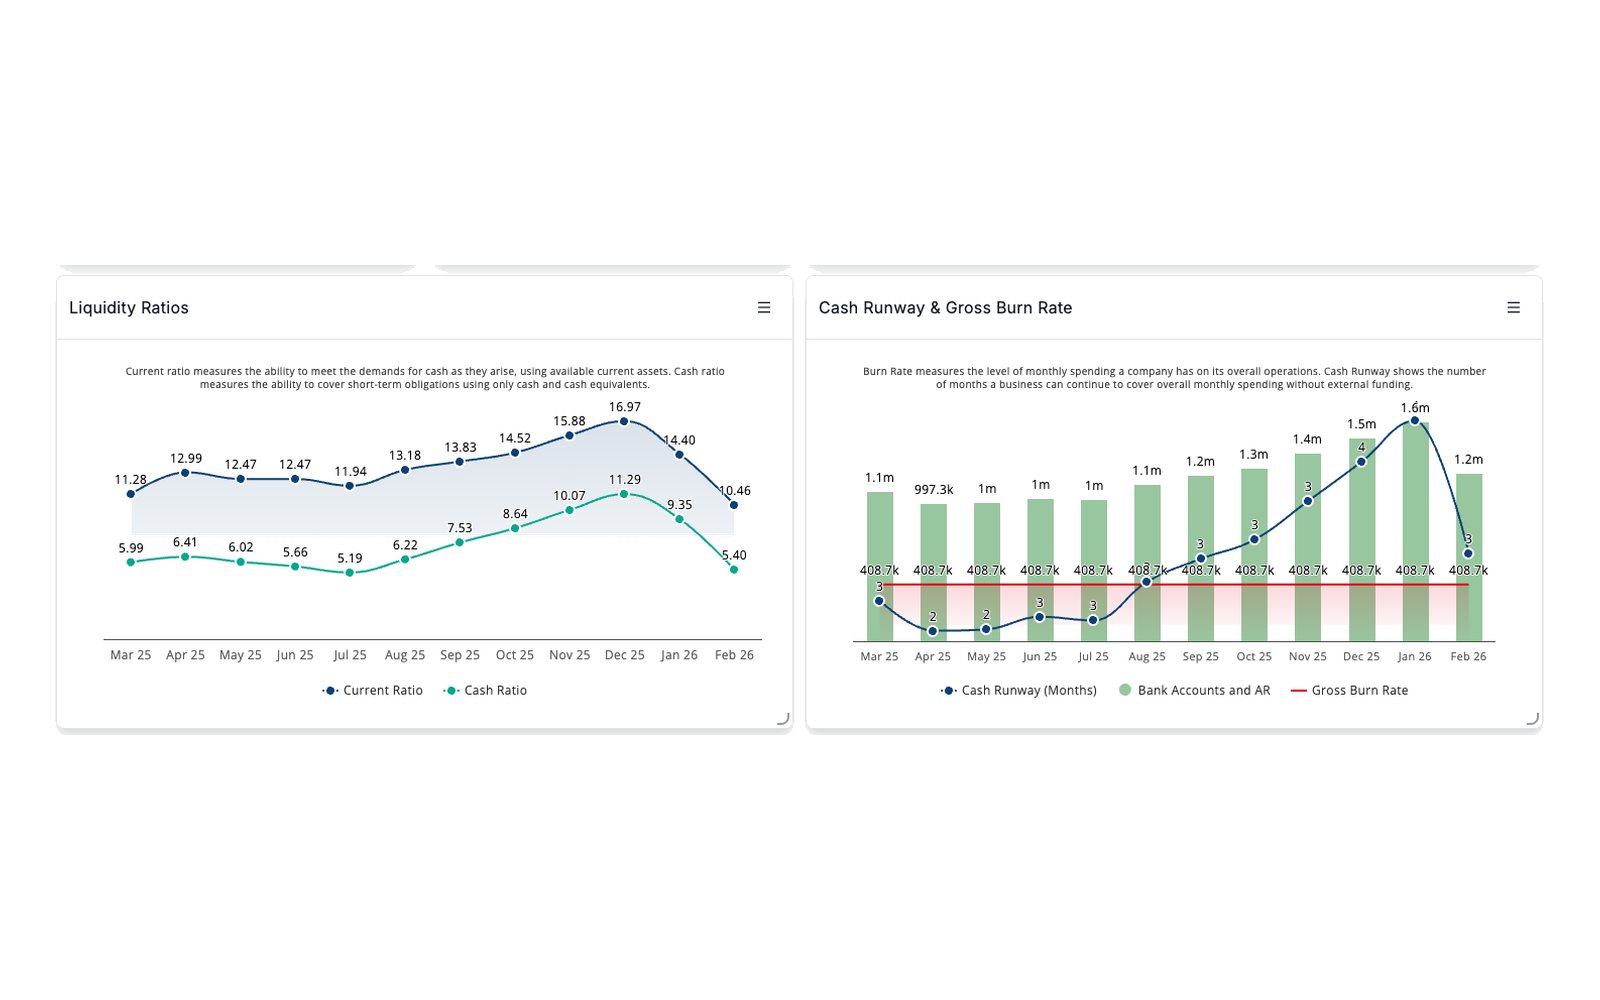
Track liquidity ratios, cash runway, and burn rate, plus the non-financial drivers in your PlanGuru assumptions, like sales per labor hour or order accuracy.
Reports That Tell One Consistent Story
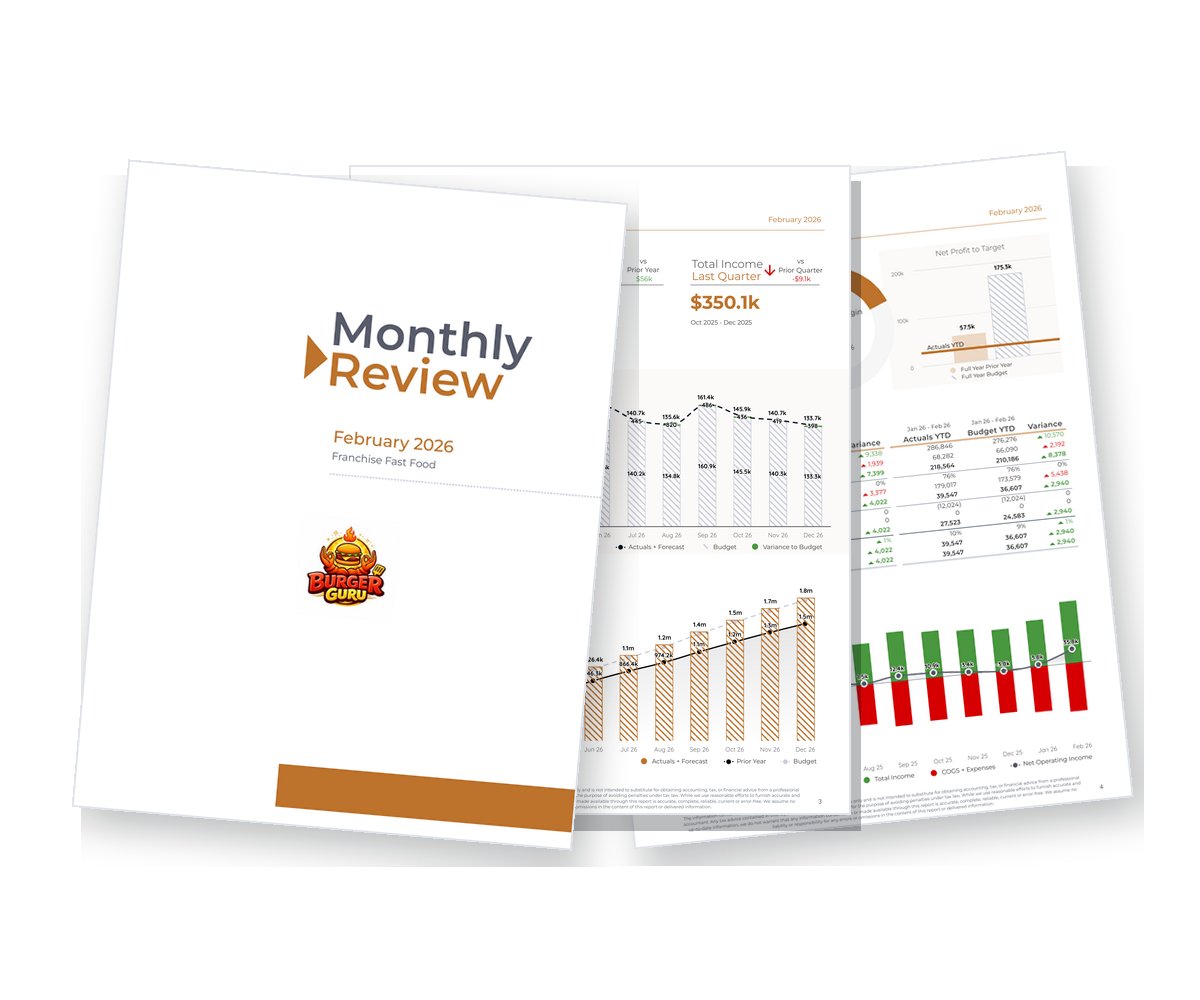
Monthly reviews, quarterly reports, and board meetings need structure. Reports make sure everyone sees what was planned, what actually happened, and what comes next, with the same definitions at the same time.
AI Commentary in a Click
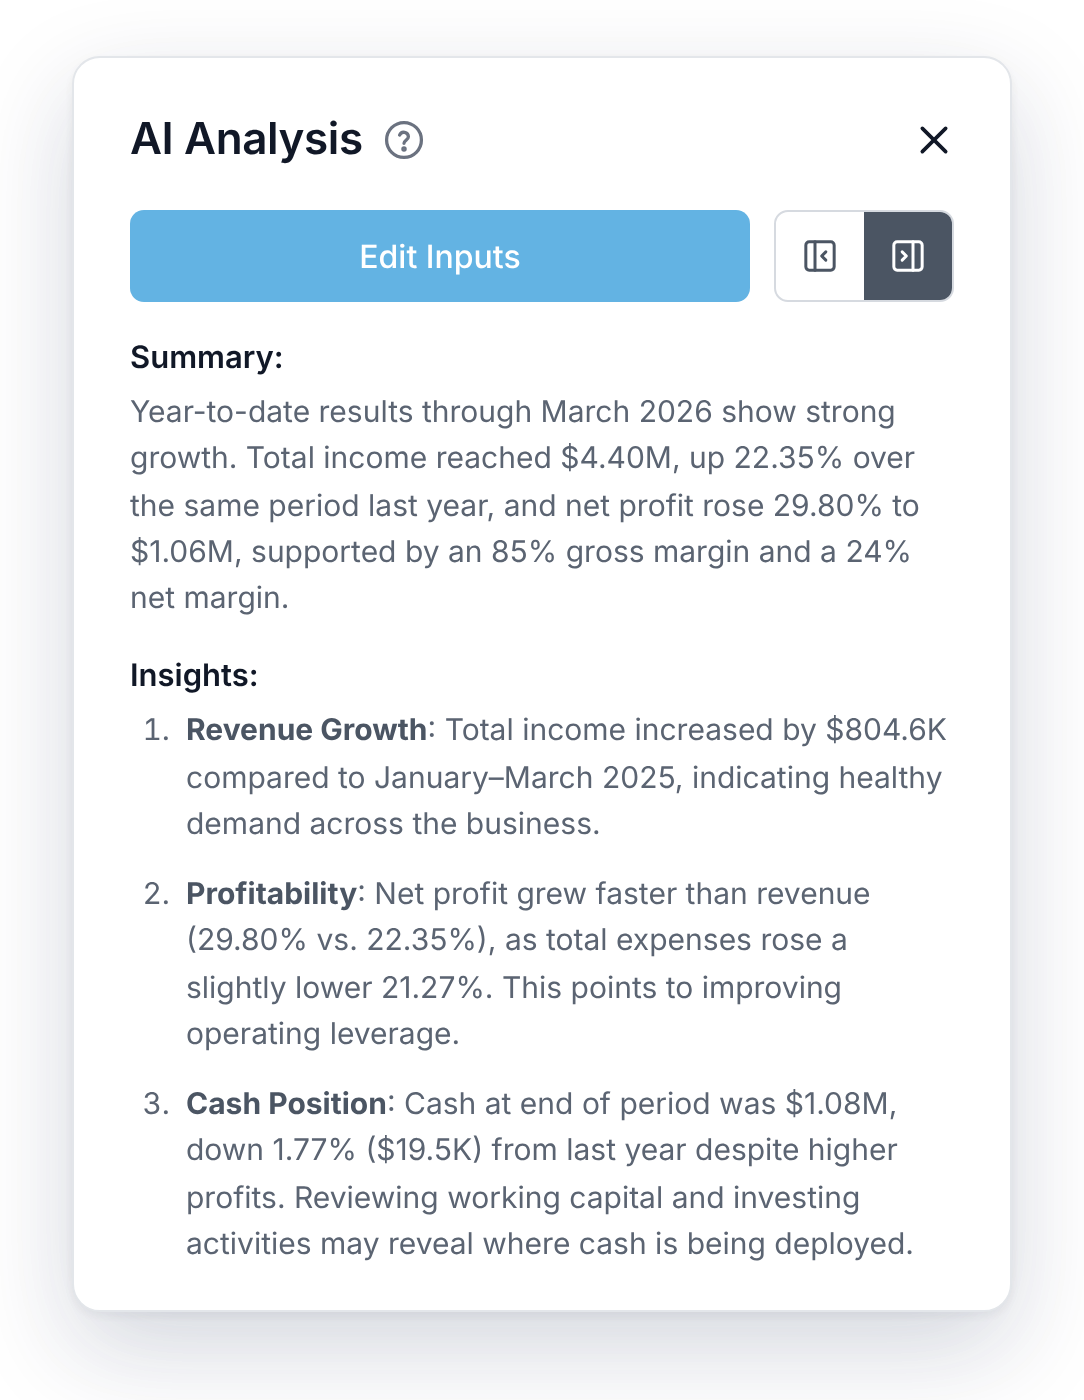
Select the metrics on any dashboard, click Analyze, and PlanGuru Analytics writes commentary on what’s driving your results.
Share the Right View With the Right People
Financial planning shouldn’t live in one person’s inbox. Role-based access replaces emailed spreadsheets with one shared system everyone trusts. Hover over each level to see who it’s for.
Group Access
For admins, workspace owners, and advisorsFull Workspace Control
Access every company in the workspace. Ideal for firm leaders and advisors who manage the full client list.Additional Users
For teammates who create the deliverablesBuild Together
Full access to a specific company so internal staff, advisors, or clients can help build dashboards and reports.Client Portal Users
For managers, executives, boards, and clientsRead-Only Views
View only the folders you assign. Managers see operational KPIs, executives see strategic rollups, and board members see summary reporting.See It in Action
Watch a PlanGuru model go from numbers to board-ready dashboards and reports in just a few clicks.
Frequently Asked Questions
Dashboards & Reporting FAQs
See Your Numbers in a Whole New Light
Templates to get started fast, customization to make every deliverable your own. Start a free trial or join a live demo to see PlanGuru Analytics in action.